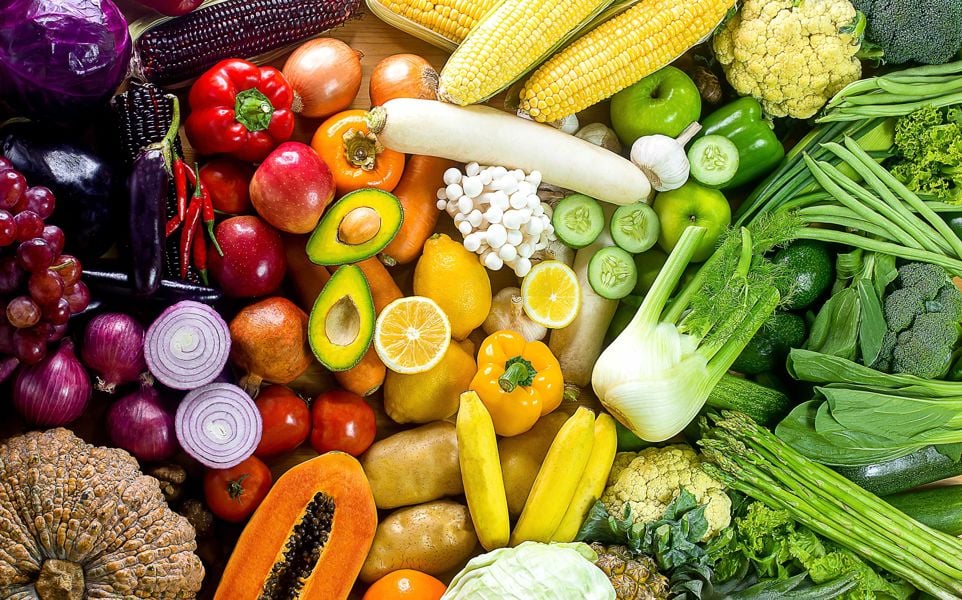
Size of the Global Produce Industry
In 2023, according to International Trade Center (ITC) using the broad category of 07, USD $95.5 billion dollars of vegetable products were exported globally. This was 11% growth from 2022 demonstrating a vibrant global industry. In 2023, according to ITC using the broad category of 08, USD $146.6 billion dollars in fruit products were exported globally. This allowed the industry to regain its loss from 2022. Fruit exports declined in 2022 primarily due to disruptions caused by the war in Ukraine, leading to increased energy costs, logistics challenges, and disruptions in fertilizer supplies, particularly in major fruit producing regions, alongside issues like climate change impacting crop yields and production shortages in key fruit producing areas.
Global Exports of Vegetable Products
| Export $ | % of Growth | |
| 2019 | 73,737,624 | |
| 2020 | 76,770,752 | 4% |
| 2021 | 83,507,674 | 8% |
| 2022 | 85,281,201 | 2% |
| 2023 | 95,535,765 | 11% |
Global Exports of Fruit Products
| Export $ | % of Growth | |
| 2019 | 128,882,263 | |
| 2020 | 133,867,563 | 4% |
| 2021 | 146,503,926 | 9% |
| 2022 | 139,243,335 | -5% |
| 2023 | 146,588,000 | 5% |
Imported Fruits and Vegetables to the US
U.S. fruit and vegetable imports are at record volumes. Between 2007 and 2021, the percent of U.S. fresh fruit and vegetable availability supplied by imports grew from 50% to 60% for fresh fruit and from 20% to 38% for fresh vegetables (excluding potatoes, sweet potatoes, and mushrooms) according to the USDA. In 2022, Mexico and Canada supplied 51% and 2%, respectively, of U.S. fresh fruit imports, and 69% and 20%, respectively, of U.S. fresh vegetable imports in terms of value. (USDA) Cucumbers, tomatoes, onions and cabbages are the largest commodities imported from Mexico and Canada. Rising imports are both a cause and effect of the reduction in U.S. fresh fruit and vegetable production, which declined in volume by 10% and 23%, respectively, since 2000. U.S. fresh fruit and vegetable production is declining due to land loss because of urban encroachment, diseases such as citrus greening, and a lack of affordable and available farm labor.
Top 5 Partners exporting produce to the U.S.
Fruits
Mexico
Peru
Chile
Guatemala
Costa Rica
Vegetables
Mexico
Canada
Peru
Guatemala
China
Exported Fruits and Vegetable from the U.S.
In 2021/2022, top U.S. fruit markets were Canada, Mexico, the Republic of Korea (South Korea), and Japan, and top commodities included apples, grapes, strawberries, oranges, and cherries. (USDA)
Several factors impacted US fruit exports in 2023 and 2024, including:
- Crop production - The USDA’s 2024 production forecast is up for peaches, table grapes, and cranberries, but down for apples, pears, walnuts, and wine grapes.
- Labor costs - For U.S. fruit and vegetable production – labor costs account for 39% and 29% of input costs, respectively.
- Ocean freight rates - Ocean freight rates are high due to a limited supply of containers and strong global demand.
- Free trade agreements - The U.S. has not entered any new free trade agreements since 2012, while other countries have continued to sign more.
- China’s economic uncertainty - China is trying to become less dependent on agricultural imports from the U.S.

2024 Produce Industry Report
Discover essential insights for navigating the 2024 produce industry. Brace for global economic shifts, track consumer behavior & stay ahead of challenges.
Learn More